Microsoft · 2025
Video Game Sales
Power BI Report
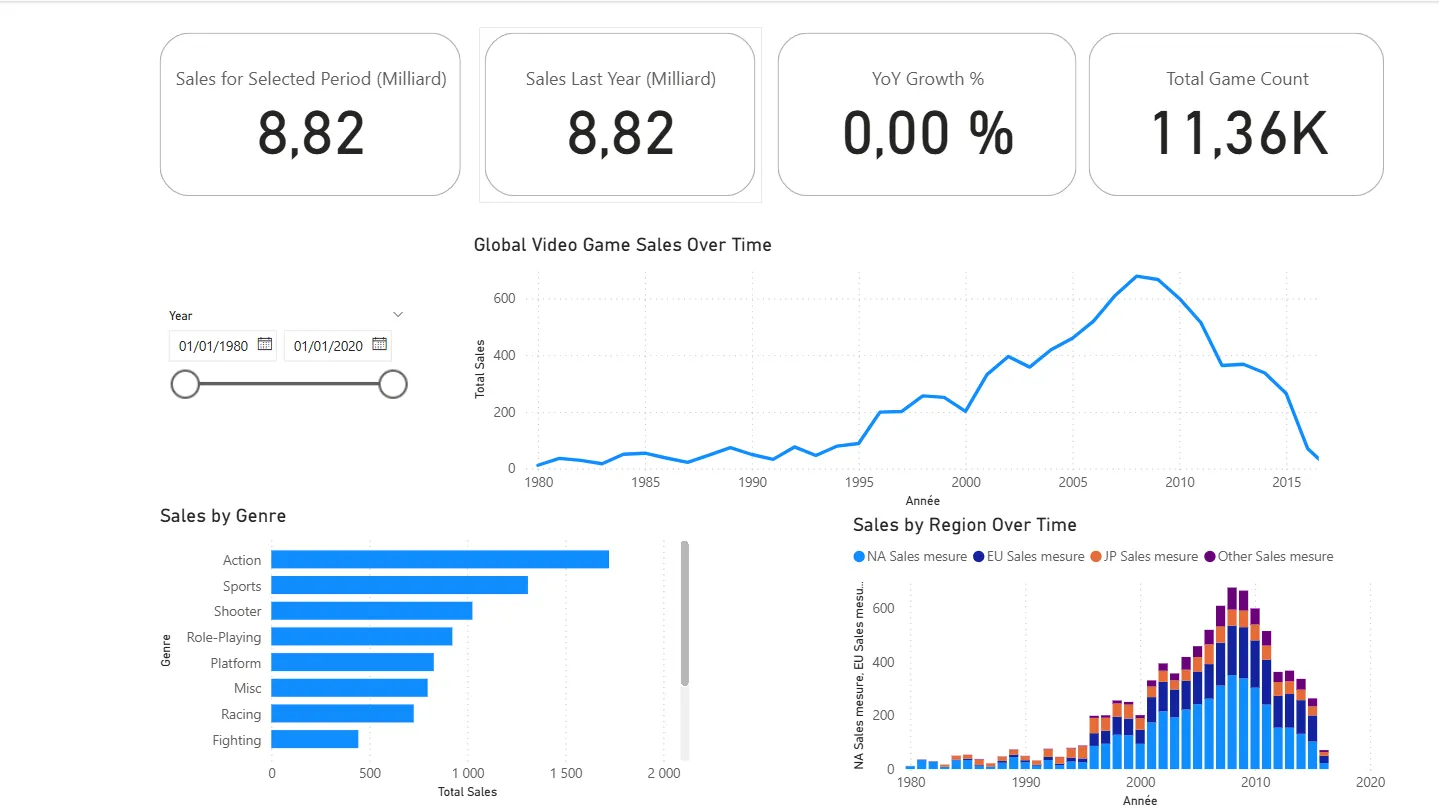
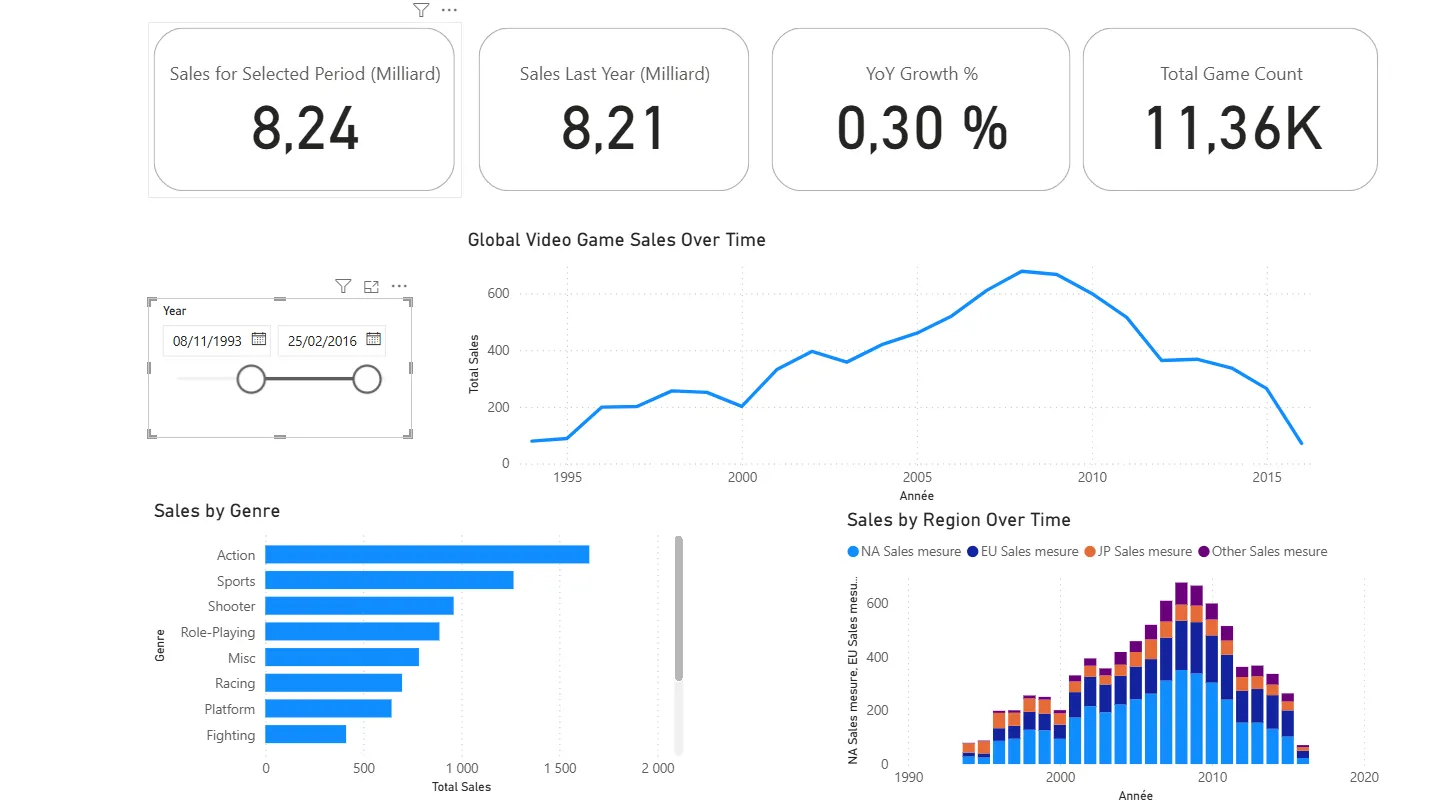
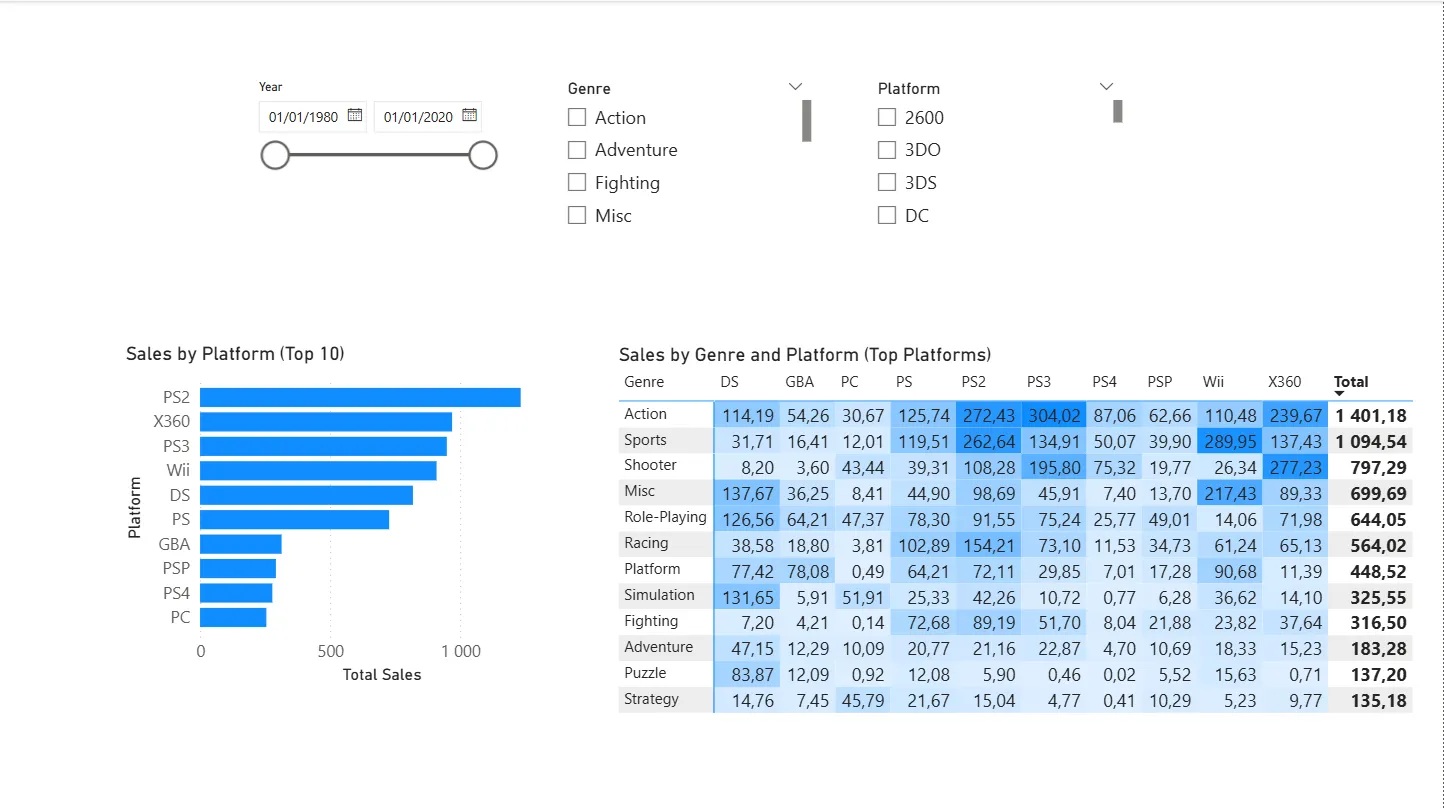
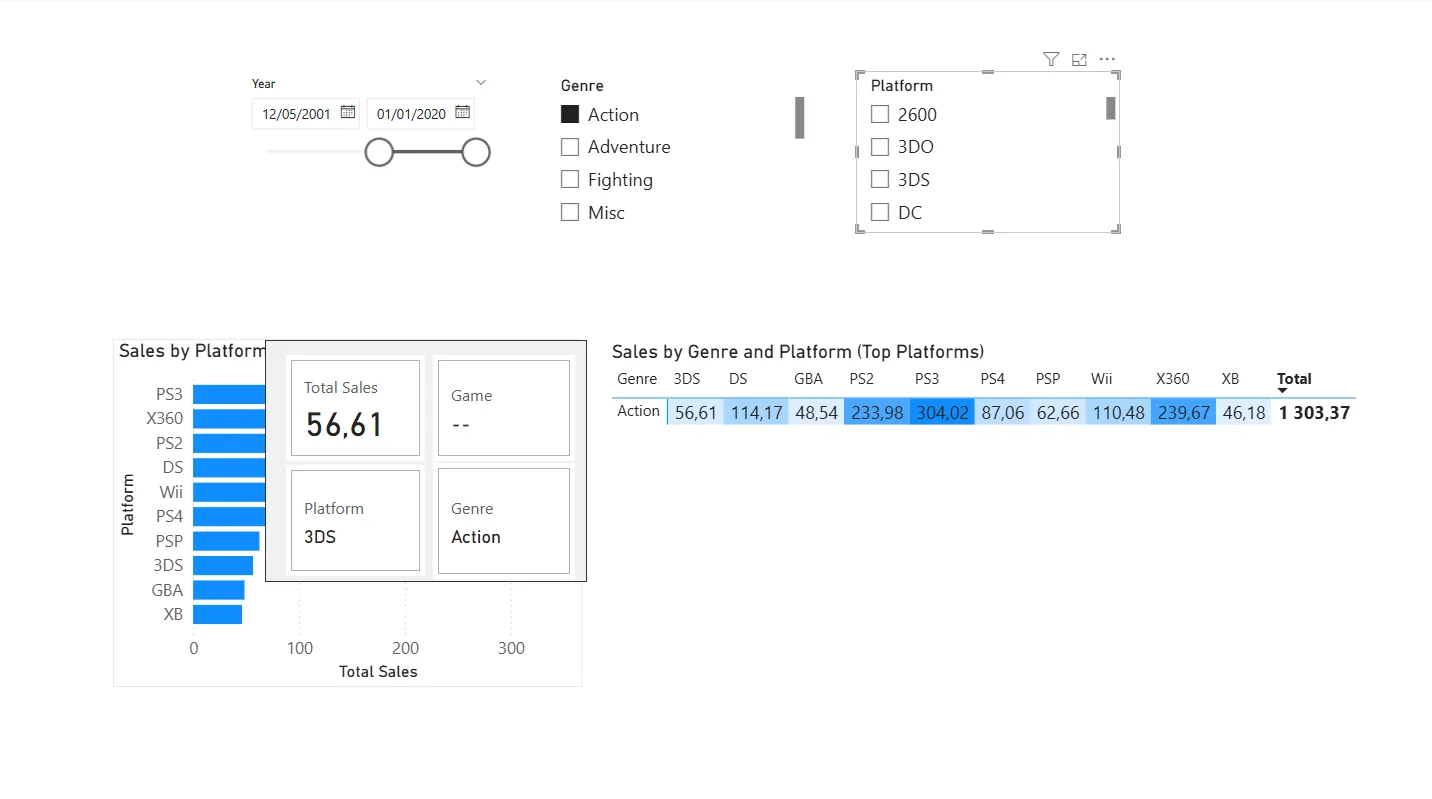
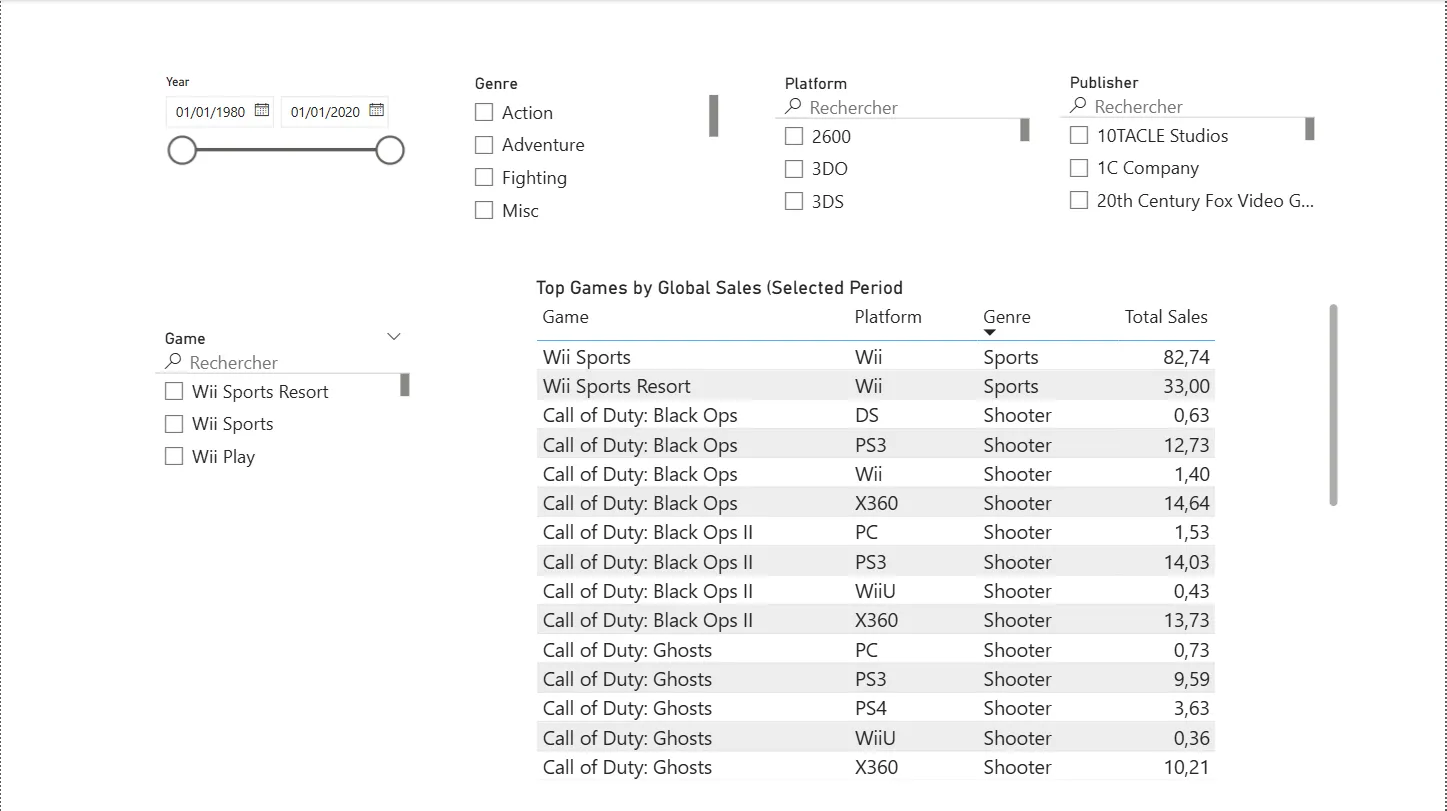
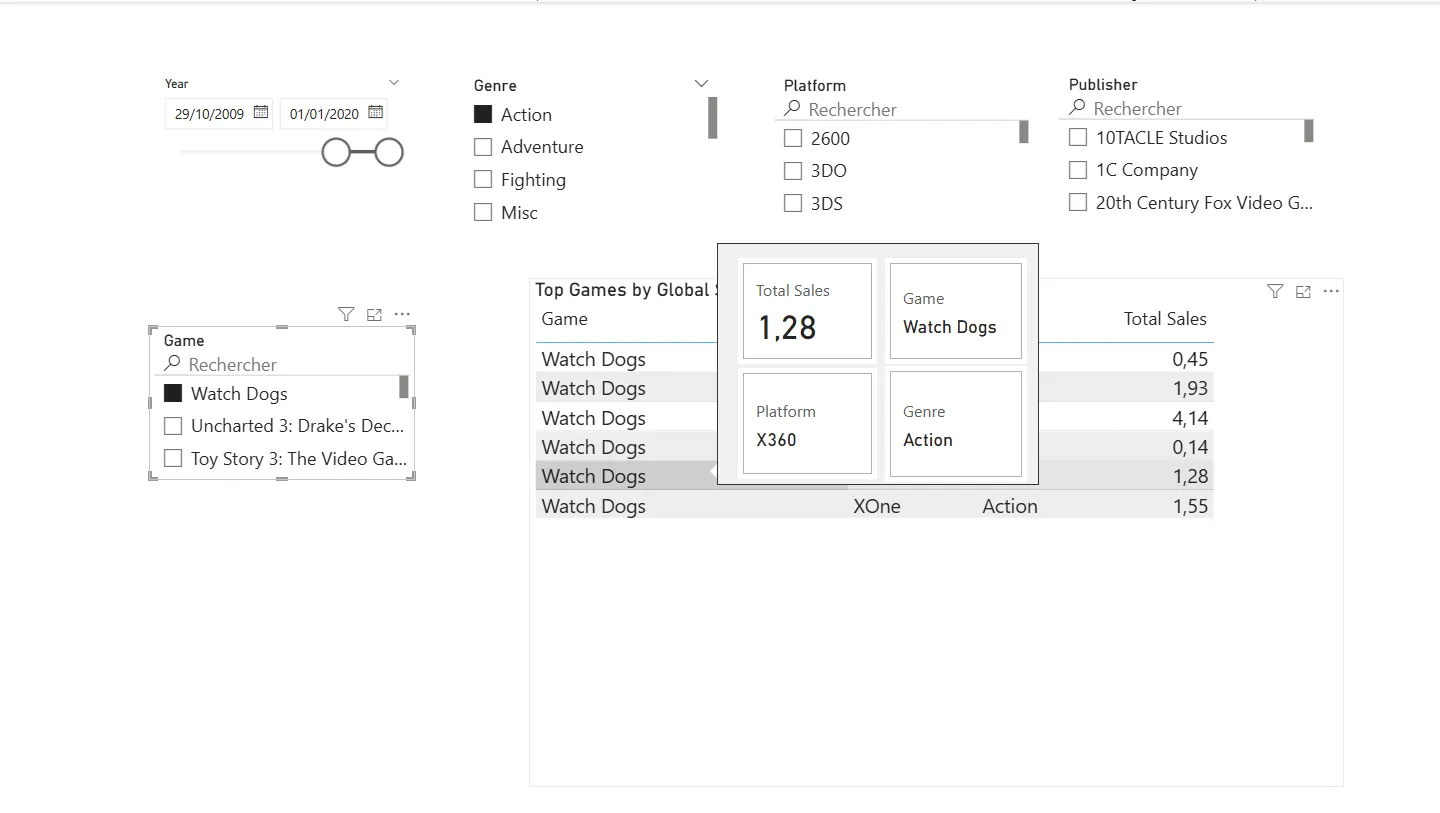
Interactive dashboard created from the Kaggle video game sales data set. I used it as a sandbox to rehearse PL-300 skills: data modeling, DAX measures, dynamic tooltips and responsive layouts. This page summarizes the report story and the insights surfaced in each tab.

The idea
Portfolio case study
03 The result
Built a star schema model with fact and dimension tables (Date, Genre, Platform, Publisher, Game)
Created dynamic KPIs, time-based analysis, and Top N rankings using DAX
Designed interactive pages with slicers, drill-down exploration, and intelligent tooltips
Improved data readability and insights through clean UX and structured report pages
Where it stands
Personal portfolio project interactive demo available via screenshots and video
Gallery
Video walkthrough
Short demo recording showing navigation between tabs, slicer interactions and how the insights are presented live.
Built with
Power BIPower QueryDAXData Modeling